Showing posts with label mortgage guidelines. Show all posts

Wednesday, March 16, 2022

Affordability Factors


Key Factors That Impact Affordability Today

Key Factors That Impact Affordability Today | MyKCM

You can’t read an article about residential real estate without the author mentioning the affordability challenges that today’s buyers face. There’s no doubt homes are less affordable today than they were over the last two years, but that doesn’t mean homes are now unaffordable.

There are three measures used to establish home affordability: home prices, mortgage rates, and wages. Let’s look closely at each of these components.

1. Home Prices

The most recent Home Price Insights report by CoreLogic shows home values have increased by 19.1% from last January to this January. That was one reason affordability declined over the past year.

2. Mortgage Rates

While the current global uncertainty makes it difficult to project mortgage rates, we do know current rates are almost one full percentage point higher than they were last year. According to Freddie Mac, the average monthly rate for last February was 2.81%. This February it was 3.76%. That increase in the mortgage rate also contributes to homes being less affordable than they were last year.

3. Wages

The one big, positive component in the affordability equation is an increase in American wages. In a recent article by RealtyTrac, Peter Miller addresses that point:

“Prices are up, but what about wages? ADP reports that job holder incomes increased 5.9% last year but rose 8.0% for those who switched employers. In effect, some of the higher cost to buy a home has been offset by more cash income.”

The National Association of Realtors (NAR) also recently released information that looks at income and affordability. The NAR data provides a comparison of the current median family income versus the qualifying income for a median-priced home in each region of the country. Here’s a graph of their findings:

Key Factors That Impact Affordability Today | MyKCM

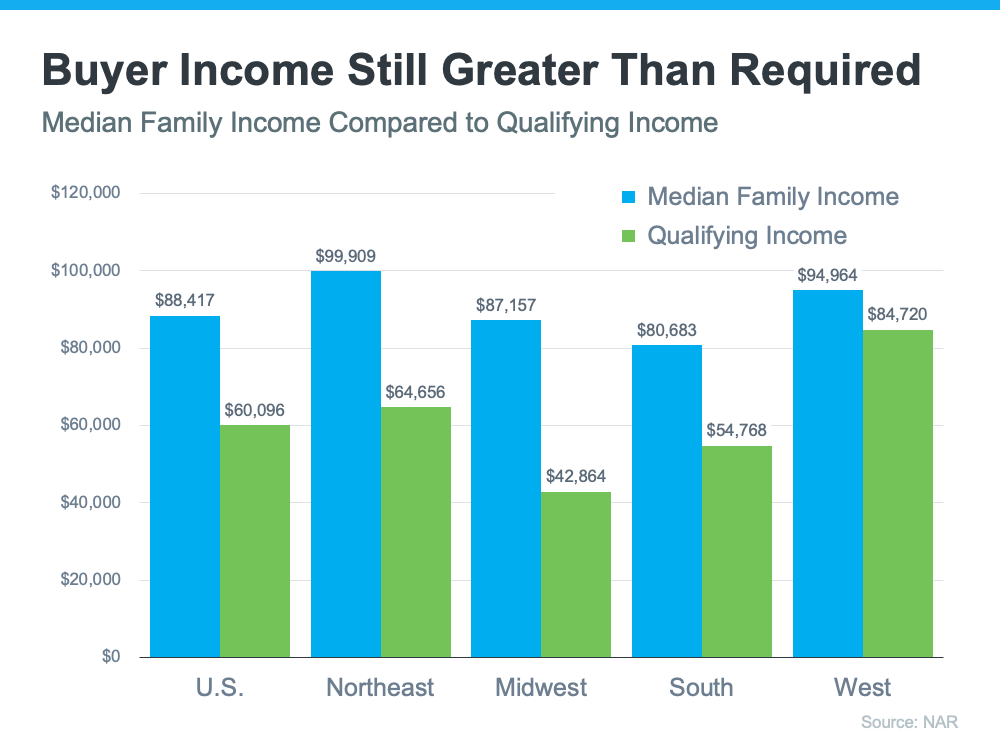
As the graph shows, the median family income (shown in blue on the graph) is greater than the qualifying income needed to buy a median-priced home (shown in green on the graph) in all four regions of the country. While those figures may vary in certain locations within each region, it’s important to note that, in most of the country, homes are still affordable.

So, when you think about affordability, remember that the picture includes more than just home prices and mortgage rates. When prices rise and rates rise, it does impact affordability, and experts project both of those things will climb in the months ahead. That’s why it’s less affordable to buy a home than it was over the past two years when prices and rates were lower than they are today. But wages need to be factored into affordability as well. Because wages have been rising, they’re a big reason that, while less affordable, homes are not unaffordable today.

Bottom Line

To find out more about affordability in our local area, let’s discuss where home prices are locally, what’s happening with mortgage rates, and get you in contact with a lender so you can make an informed financial decision. Remember, while less affordable, homes are not unaffordable, which still gives you an opportunity to buy today.

Thursday, February 17, 2022

It's Not a Bubble, and Here's Why


4 Simple Graphs Showing Why This Is Not a Housing Bubble

4 Simple Graphs Showing Why This Is Not a Housing Bubble | MyKCM

recent survey revealed that many consumers believe there’s a housing bubble beginning to form. That feeling is understandable, as year-over-year home price appreciation is still in the double digits. However, this market is very different than it was during the housing crash 15 years ago. Here are four key reasons why today is nothing like the last time.

1. Houses Are Not Unaffordable Like They Were During the Housing Boom

The affordability formula has three components: the price of the home, wages earned by the purchaser, and the mortgage rate available at the time. Conventional lending standards say a purchaser should not spend more than 28% of their gross income on their mortgage payment.

Fifteen years ago, prices were high, wages were low, and mortgage rates were over 6%. Today, prices are still high. Wages, however, have increased, and the mortgage rate, even after the recent spike, is still well below 6%. That means the average purchaser today pays less of their monthly income toward their mortgage payment than they did back then.

In the latest Affordability Report by ATTOM Data, Chief Product Officer Todd Teta addresses that exact point:

“The average wage earner can still afford the typical home across the U.S., but the financial comfort zone continues shrinking as home prices keep soaring and mortgage rates tick upward.”

Affordability isn’t as strong as it was last year, but it’s much better than it was during the boom. Here’s a chart showing that difference:

4 Simple Graphs Showing Why This Is Not a Housing Bubble | MyKCM

If costs were so prohibitive, how did so many homes sell during the housing boom?

2. Mortgage Standards Were Much More Relaxed During the Boom

During the housing bubble, it was much easier to get a mortgage than it is today. As an example, let’s review the number of mortgages granted to purchasers with credit scores under 620. According to credit.org, a credit score between 550-619 is considered poor. In defining those with a score below 620, they explain:

“Credit agencies consider consumers with credit delinquencies, account rejections, and little credit history as subprime borrowers due to their high credit risk.”

Buyers can still qualify for a mortgage with a credit score that low, but they’re considered riskier borrowers. Here’s a graph showing the mortgage volume issued to purchasers with a credit score less than 620 during the housing boom, and the subsequent volume in the 14 years since.

4 Simple Graphs Showing Why This Is Not a Housing Bubble | MyKCM

Mortgage standards are nothing like they were the last time. Purchasers that acquired a mortgage over the last decade are much more qualified. Let’s take a look at what that means going forward.

3. The Foreclosure Situation Is Nothing Like It Was During the Crash

The most obvious difference is the number of homeowners that were facing foreclosure after the housing bubble burst. The Federal Reserve issues a report showing the number of consumers with a new foreclosure notice. Here are the numbers during the crash compared to today:

4 Simple Graphs Showing Why This Is Not a Housing Bubble | MyKCM

There’s no doubt the 2020 and 2021 numbers are impacted by the forbearance program, which was created to help homeowners facing uncertainty during the pandemic. However, there are fewer than 800,000 homeowners left in the program today, and most of those will be able to work out a repayment plan with their banks.

Rick Sharga, Executive Vice President of RealtyTracexplains:

“The fact that foreclosure starts declined despite hundreds of thousands of borrowers exiting the CARES Act mortgage forbearance program over the last few months is very encouraging. It suggests that the ‘forbearance equals foreclosure’ narrative was incorrect.”

Why are there so few foreclosures now? Today, homeowners are equity rich, not tapped out.

In the run-up to the housing bubble, some homeowners were using their homes as personal ATM machines. Many immediately withdrew their equity once it built up. When home values began to fall, some homeowners found themselves in a negative equity situation where the amount they owed on their mortgage was greater than the value of their home. Some of those households decided to walk away from their homes, and that led to a rash of distressed property listings (foreclosures and short sales), which sold at huge discounts, thus lowering the value of other homes in the area.

Homeowners, however, have learned their lessons. Prices have risen nicely over the last few years, leading to over 40% of homes in the country having more than 50% equity. But owners have not been tapping into it like the last time, as evidenced by the fact that national tappable equity has increased to a record $9.9 trillion. With the average home equity now standing at $300,000, what happened last time won’t happen today.

As the latest Homeowner Equity Insights report from CoreLogic explains:

“Not only have equity gains helped homeowners more seamlessly transition out of forbearance and avoid a distressed sale, but they’ve also enabled many to continue building their wealth.”

There will be nowhere near the same number of foreclosures as we saw during the crash. So, what does that mean for the housing market?

4. We Don’t Have a Surplus of Homes on the Market – We Have a Shortage

The supply of inventory needed to sustain a normal real estate market is approximately six months. Anything more than that is an overabundance and will causes prices to depreciate. Anything less than that is a shortage and will lead to continued price appreciation. As the next graph shows, there were too many homes for sale from 2007 to 2010 (many of which were short sales and foreclosures), and that caused prices to tumble. Today, there’s a shortage of inventory, which is causing the acceleration in home values to continue.

4 Simple Graphs Showing Why This Is Not a Housing Bubble | MyKCM

Inventory is nothing like the last time. Prices are rising because there’s a healthy demand for homeownership at the same time there’s a shortage of homes for sale.

Bottom Line

If you’re worried that we’re making the same mistakes that led to the housing crash, the graphs above show data and insights to help alleviate your concerns.

Why I Still Think You Should Buy That House, Even Now.

  Invest in Yourself by Owning a Home Are you wondering if it makes sense to buy a home right now? While today’s mortgage rates might seem a...